


Portfolio Update
January 1, 2000 - June 17, 2016
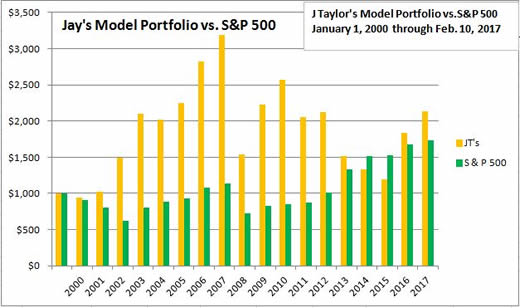
The bear market for gold and gold shares has come to an end during the early days of 2016. With our model portfolio up over 60%, our portfolio has now once again outperformed the S&P 500 since January 1, 2000. Unfortunately, gold is rising because the global economy is an absolute mess, thanks to policy makers in governments and central banks around the world. A big lie that is to blame for a global economy that remains in a depression has been sold to the populace. That big lie is that you can spend your way to prosperity. In fact, every new wave of quantitative easing results in more misguided investments that fail to generate sufficient income to service new debt from which money was manufactured. As the world gains an understanding that fiat money is in fact worthless, a growing number of investors are swapping major currencies for nature's money, namely gold and silver.
Why have markets chosen gold and silver as money for more than 5000 years and why can you be sure we are in the early days of a massive rise in the price of gold? Doug Casey has often recited the reasons why the collective wisdom of markets always choose gold as a medium of exchange:
- Gold is durable--that's why we don't use wheat.
- Gold is divisible--that's why we don't use diamonds.
- Gold is convenient--that's why we don't use lead.
- Gold is consistent--that's why we don't use real estate.
- Gold has intrinsic value--that's why we don't or shouldn't use paper or digits.
As the global economy grinds to a halt and fiat money systems self destruct, companies producing real money--gold--are starting to prosper. Knowing which mining companies can prosper most during the bull market in gold is important. We can help you learn which companies to buy and which ones to avoid. Subscribe now to J. Taylor's Gold, Energy & Tech Stocks